Integrated platform
Plant operations
Management board, production schedule, OEE, scrap, downtime and Kanban in a single HTML file that processes the plant’s spreadsheets in the browser.
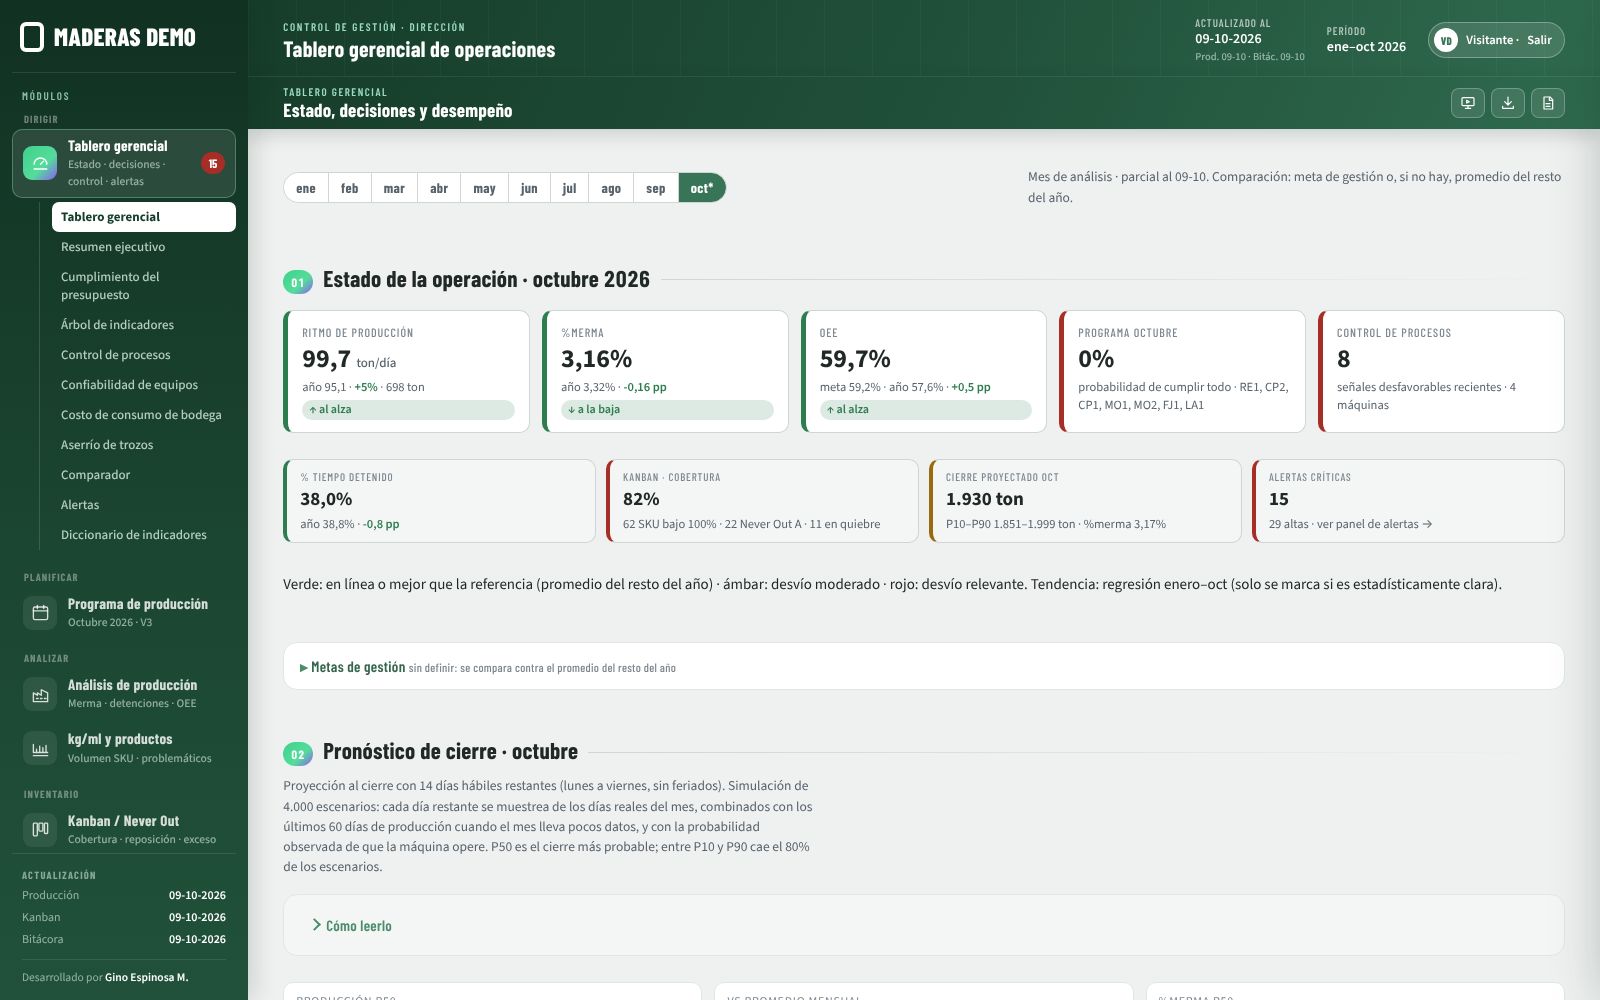 Open the demo full screen ↗The demo opens with fictional data and its interface is in Spanish. It works offline once loaded.
Problem
Production, scrap, downtime and stock data lived in separate spreadsheets. The weekly report arrived too late to act, and each area measured differently.
Solution
A single-file platform: it reads operational spreadsheets, consolidates production and scrap without month-end double counting, cross-references the downtime log and computes OEE, loss causes, schedule feasibility and Kanban coverage. Findings are written from the data. In this demo, a Python plant simulator generates the same spreadsheets the plant would deliver, and the report processes them with the real pipeline.
Architecture
- 01SourceOperational spreadsheets · downtime log · monthly schedule · Kanban
- 02ProcessingPython + pandas running in the browser via Pyodide; SciPy-free statistical tests
- 03ModelProduction, scrap and downtime by machine, SKU, shift and day
- 04DeliverySelf-contained HTML, printable to PDF, light and dark modes
Views
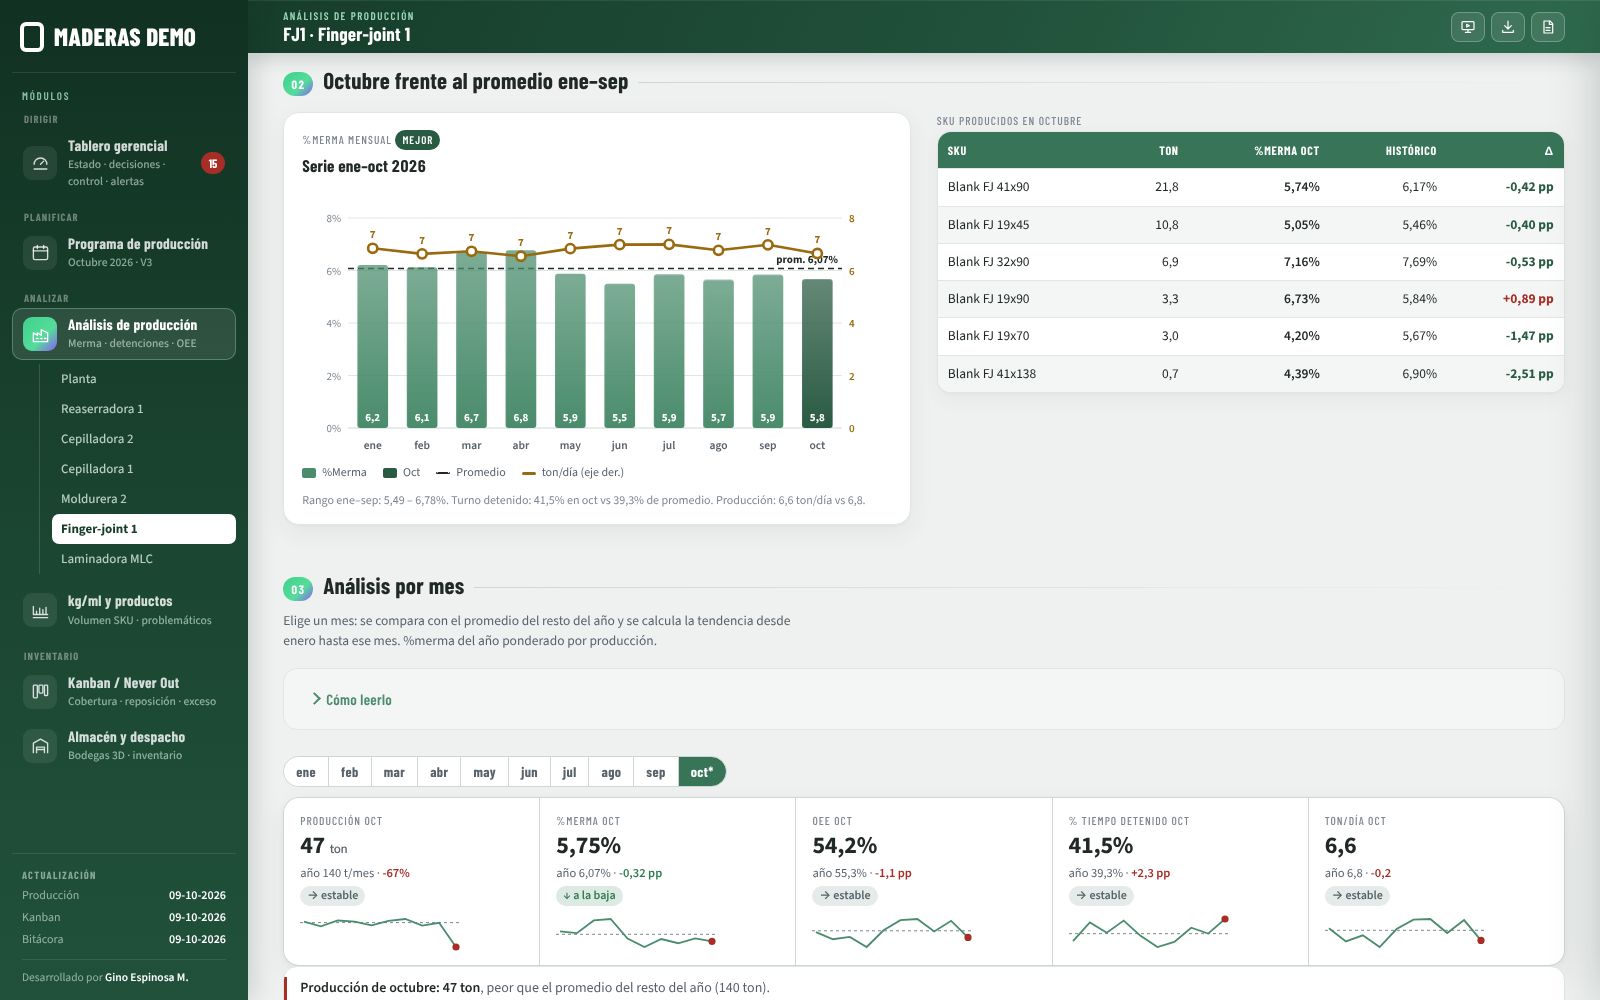
Try it yourself
Download the synthetic spreadsheets, open them and import them back into the demo (Importar button): the report is recomputed in your browser with Python (Pyodide), no servers involved.